This is the set of stats that I like to pull for my clients who are thinking of selling their homes or have their homes already on the market. You may find it useful, too!
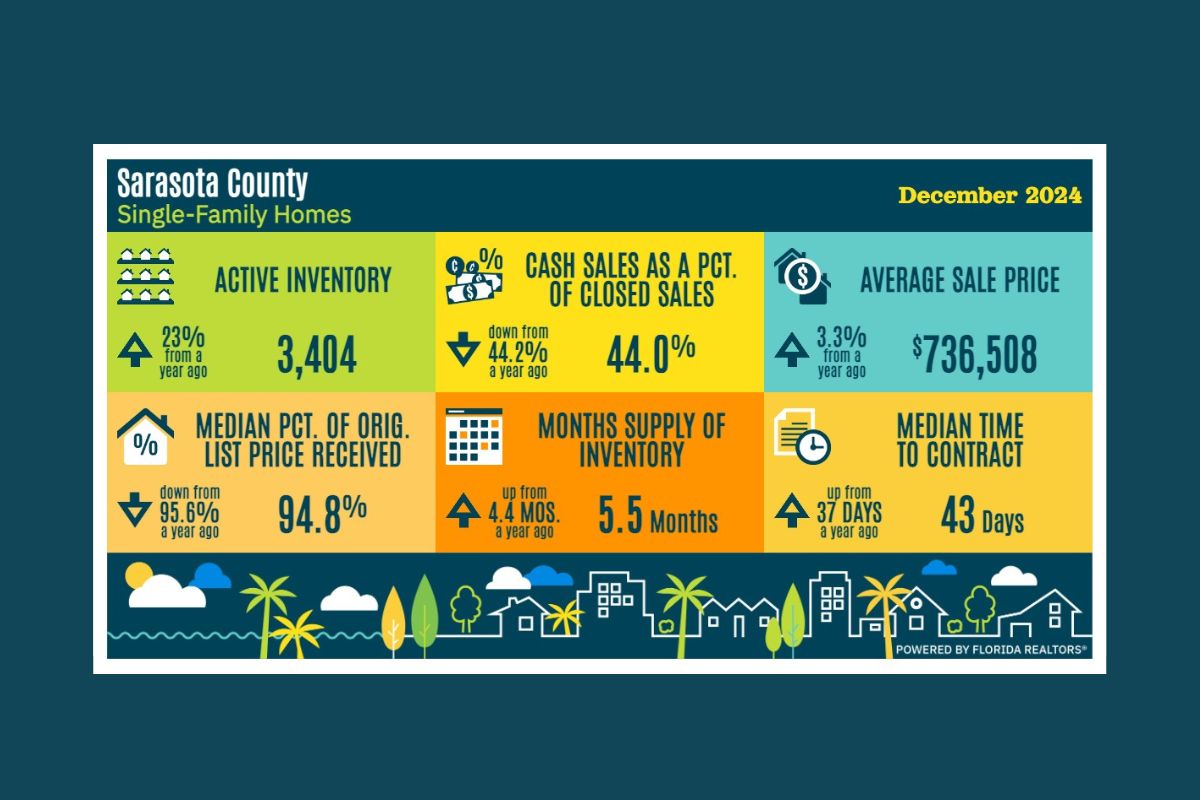
🏠🏠 You might want to know how much competition you have among other homesellers. Take a look at the active inventory; we’ve got 3,404 homes on the market and it’s trending UP from a year ago.
🏠 How likely is it that your home will sell for cash? As of last month, 44% of sales for single family homes were sold for cash.
🏠 Is your house priced more or less than what most people are paying for homes these days? Check out the average sale price, it’s currently at $736k.
📊 And when you do get an offer on our house, can you expect full price? Chances are you’ll get an offer that’s closer to 94.8% of your listed price.
🤷♀️ Are we in a seller’s market or a buyer’s market? Check out the “months supply of inventory” which shows we are sitting at 5.5 months.
⏰ If you’re wondering about how long it might take to get your house under contract, right now it’s taking about 43 days.